What's an Acceptable Cost Per Acquisition in B2B SaaS? [Guide + Free Template]


Contents:
What's an acceptable Cost Per Acquisition (CPA) in B2B SaaS? This calculation is probably the most empowering and career-enhancing skill any CMO or B2B marketer can master 📊. A simplified equation would be:
CPA < Revenue
If your CPA exceeds your revenue, it highlights a fundamental flaw in your marketing efforts or business model. Your revenue must always surpass your CPA. Why is this so important? Let's explore some potential consequences and considerations if your CPA were higher than your revenue:
If your CPA is higher than your CLTV you might experience...
1. Negative profitability:
You are spending more to acquire each customer than the revenue you expect to generate from them over their entire relationship with your business. This leads to unsustainable financial losses.
2. Cash flow problems:
Consistently spending more on acquiring customers than what they bring in can lead to significant cash flow problems, potentially jeopardizing your business’s ability to operate and grow.
3. Unsustainable growth:
Even if you manage to grow your customer base, the costs associated with acquiring these customers will outweigh the revenue, making growth unsustainable in the long term.
4. Difficulty in scaling:
Investors and stakeholders are less likely to support scaling efforts if the underlying unit economics aren't favorable. They typically look for businesses where CLTV greatly exceeds CPA, indicating potential for profitable growth.
5. Strategic shifts required:
You may need to reevaluate your customer acquisition strategies, marketing expenditures, sales processes, or pricing models to bring CPA down or increase CLTV. This could involve optimizing marketing efficiency.
How to define revenue cleary
To determine the acceptable CPA, we first need to align our definition of revenue. Revenue is influenced by many factors. I prefer to keep it simple and use the Customer Lifetime Value (CLTV), which represents the total revenue a customer is expected to generate throughout their relationship with your company. By understanding the CLTV of your customers, you can make more informed decisions about how much to invest in acquisition and retention strategies. You can either use historical averages for your customers or the expected revenue over time.
CPA < CLTV
Step-by-step guide to determining your acceptable CPA

Step 1: Understand your sales funnel
First and foremost, as a B2B marketer, you need a thorough understanding of the demand metrics required to secure a single deal. Break down your sales funnel to identify the metrics at each stage:
- Deal Metrics: Start by recognizing how many opportunities you need to close a deal. For example, closing 1 deal might require 4 opportunities.
- Opportunity Metrics: Then determine how many Marketing Qualified Leads (MQLs) convert to opportunities. For instance, if 20 MQLs convert to 4 opportunities, this is a critical metric.
- Lead Metrics: Finally, calculate how many raw leads you need to reach your MQL target. If it takes 60 raw leads to get 20 MQLs, this is your starting point.
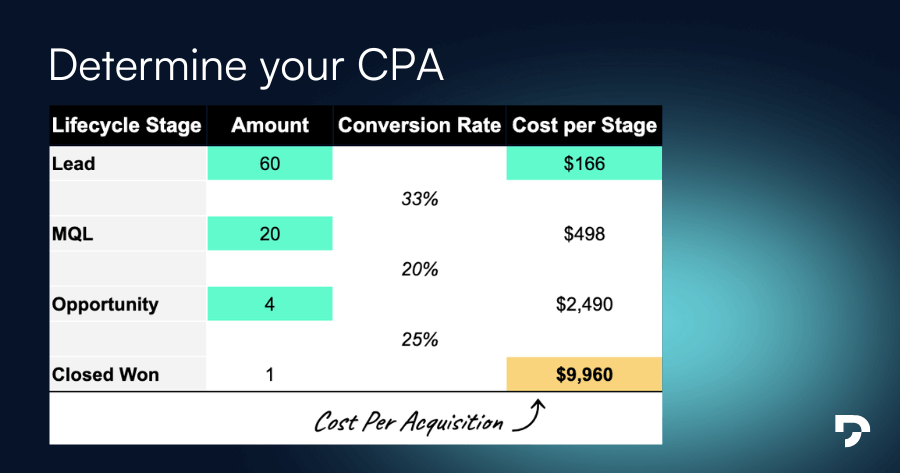
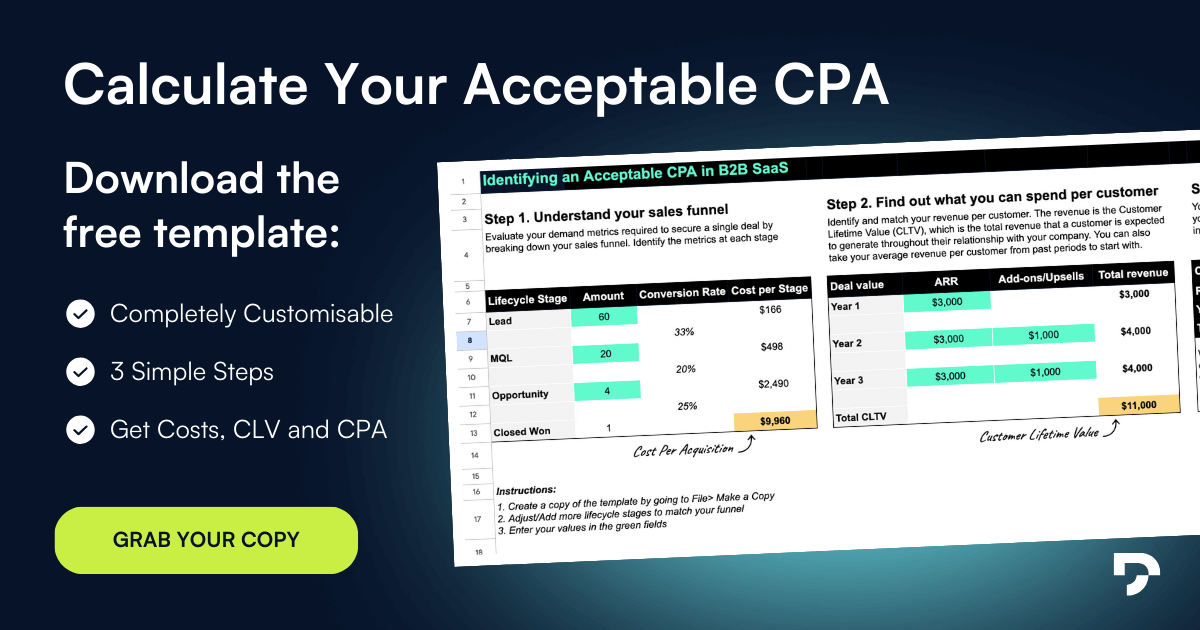
Let us continue the example above and assume you need the 60 leads to generate one deal and you know that you spend on average $166 to get a new lead. Now let us add the cost for each stage and figure out what you pay.
Cost Per Lead (CPL):
Given that only 1 in 3 leads meets the criteria to become an MQL, you can spend on average approximately $166 per lead ($498 / 3 leads).
Cost Per MQL (Marketing Qualified Lead):
If only 1 out of every 5 MQLs converts into an opportunity, you can afford to spend $498 per MQL ($2,490 / 5 MQLs).
Cost Per Opportunity:
On average, it takes 4 opportunities to win a deal, meaning you can allocate $2,490 per opportunity ($9,969/ 4 opportunities).
Cost Per Deal:
A new deal costs about $9,960.
This means you need 60 leads, 20 MQLs and 4 opportunities to close one deal.
By calculating these benchmarks, you can better manage and optimize your acquisition costs at each stage of the sales funnel.
Step 2: Understand what you can spend for a new customer
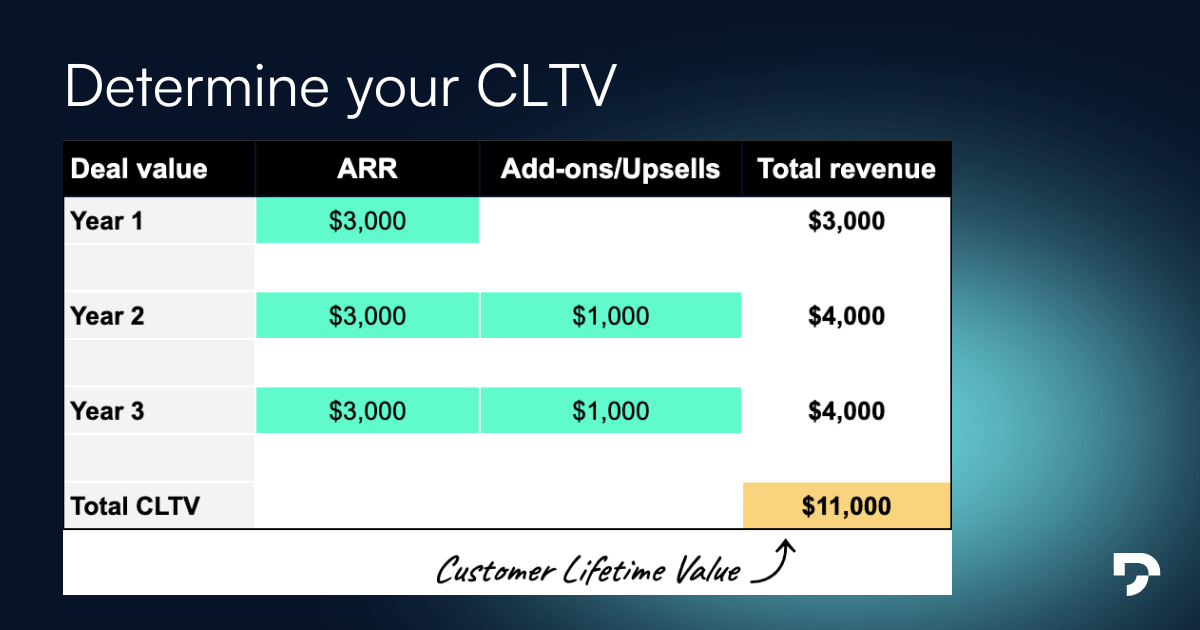
Now that you know what it costs to acquire a customer, the second step involves identifying how much you can afford to spend by determining the total revenue per customer. This requires understanding how long you typically retain a customer.
Let's assume you retain your customers for an average of 3 years before they churn. During these 3 years, you accumulate the annual recurring revenue (ARR), including potential upsells. The total revenue for this retention period is your Customer Lifetime Value (CLTV).
Step 3: Identifying an acceptable CPA
Once your have your costs per stage, the total CPA, and your CLTV you can determine your acceptable CPA. This is a good exercise to do together with your CFO. Use the free spreadsheet template I have created to simplify the evaluation process.
It is a no-brainer that your CPA needs to be lower than your revenue per customer to become profitable. This may vary depending on the growth stage you are currently in. If not, you need to increase profitability (e.g. by increasing the retention rate, increasing ARR or improving marketing efficiency).
While CPA varies from business to business, a good target for early-stage SaaS companies is a LCLTV:CPA ratio of 3:1, roughly three times lower than the CLTV.
How you calculate the CLTV:CPA ratio:
CLTV:CPA ratio = CLTV / CPA
If your ratio is ~3.0x you receive $3 per $1 spent to acquire the customer. This is a good starting point considering other company costs as office rent or salaries. If your ratio is <1.0x then the company is going face difficulty monetizing its newly acquired customers.
To go through the entire process might lead you to create a spreadsheet. Luckily, I have created a good starting point and provide a Google Spreadsheet below. If you do this together with your CFO, CCO or CEO, the process shouldn't take longer than 30 minutes.
How you find out if you are in trouble
Shortly said, if your acquisition costs are higher than your CLTV you need to take action. Let's assume the following situation:
- Average customer retention rate: 3 years
- CPA: 1,000 USD
- ARR per customer: 1000 USD
- CLTV: 3000 USD
Following the math above you generate 1000 USD per year for 3 years (until they churn) which brings you 3,000 USDs as CLTV. Deducting the CPA, you gain 2,000 USDs as revenue. This means for every customer you win, you generate 2,000 USDs. If this is profitable for your specific SaaS business, considering office rent, other recurring costs as salaries and expenses is something to discuss with your CFO.
However, if you are acquiring a customer for 1,000 USD, and your ARR is only 500 USD, you need to retain your customer for at least 2 years to go break-even. If your customer retention is less than 2 years, you lose money with every new customer, which would be not sustainable unless this is part of your growth and expansion strategy.
This is why the acceptable CPA depends a lot on your marketing, sales and product pricing strategy. The higher the ARR, the more you can spend. The more you can spend per customer ultimately also defines what acquisition strategy and channel you can use.
Benchmark your CPA
By examining the entire sales and marketing funnel, you can see how quickly these numbers add up. Although every business's CPA is unique and varies by industry and customer type, benchmark reports can provide valuable insights for comparison.
The collected SaaS benchmark data for CPAs in 2024 from Firstpageage.com gives you a good indication about where you currently are. The higher you go up market, the higher the CPA. Ultimately, your CPA also defines your marketing strategy and channels. However, keep in mind that these are just averages and relating your CPA to a CLTV:CPA ratio will give you a much better indication of what your acceptable CPA should be.

As you put these insights into action, consider scheduling a call to delve deeper into optimizing your marketing strategies, ensuring that your journey towards becoming a more effective marketer is continually supported.
Frequently Asked Questions


Recent resources

What is a CRM system and How Can it Actually Make Your B2B Sales Process More Efficient?